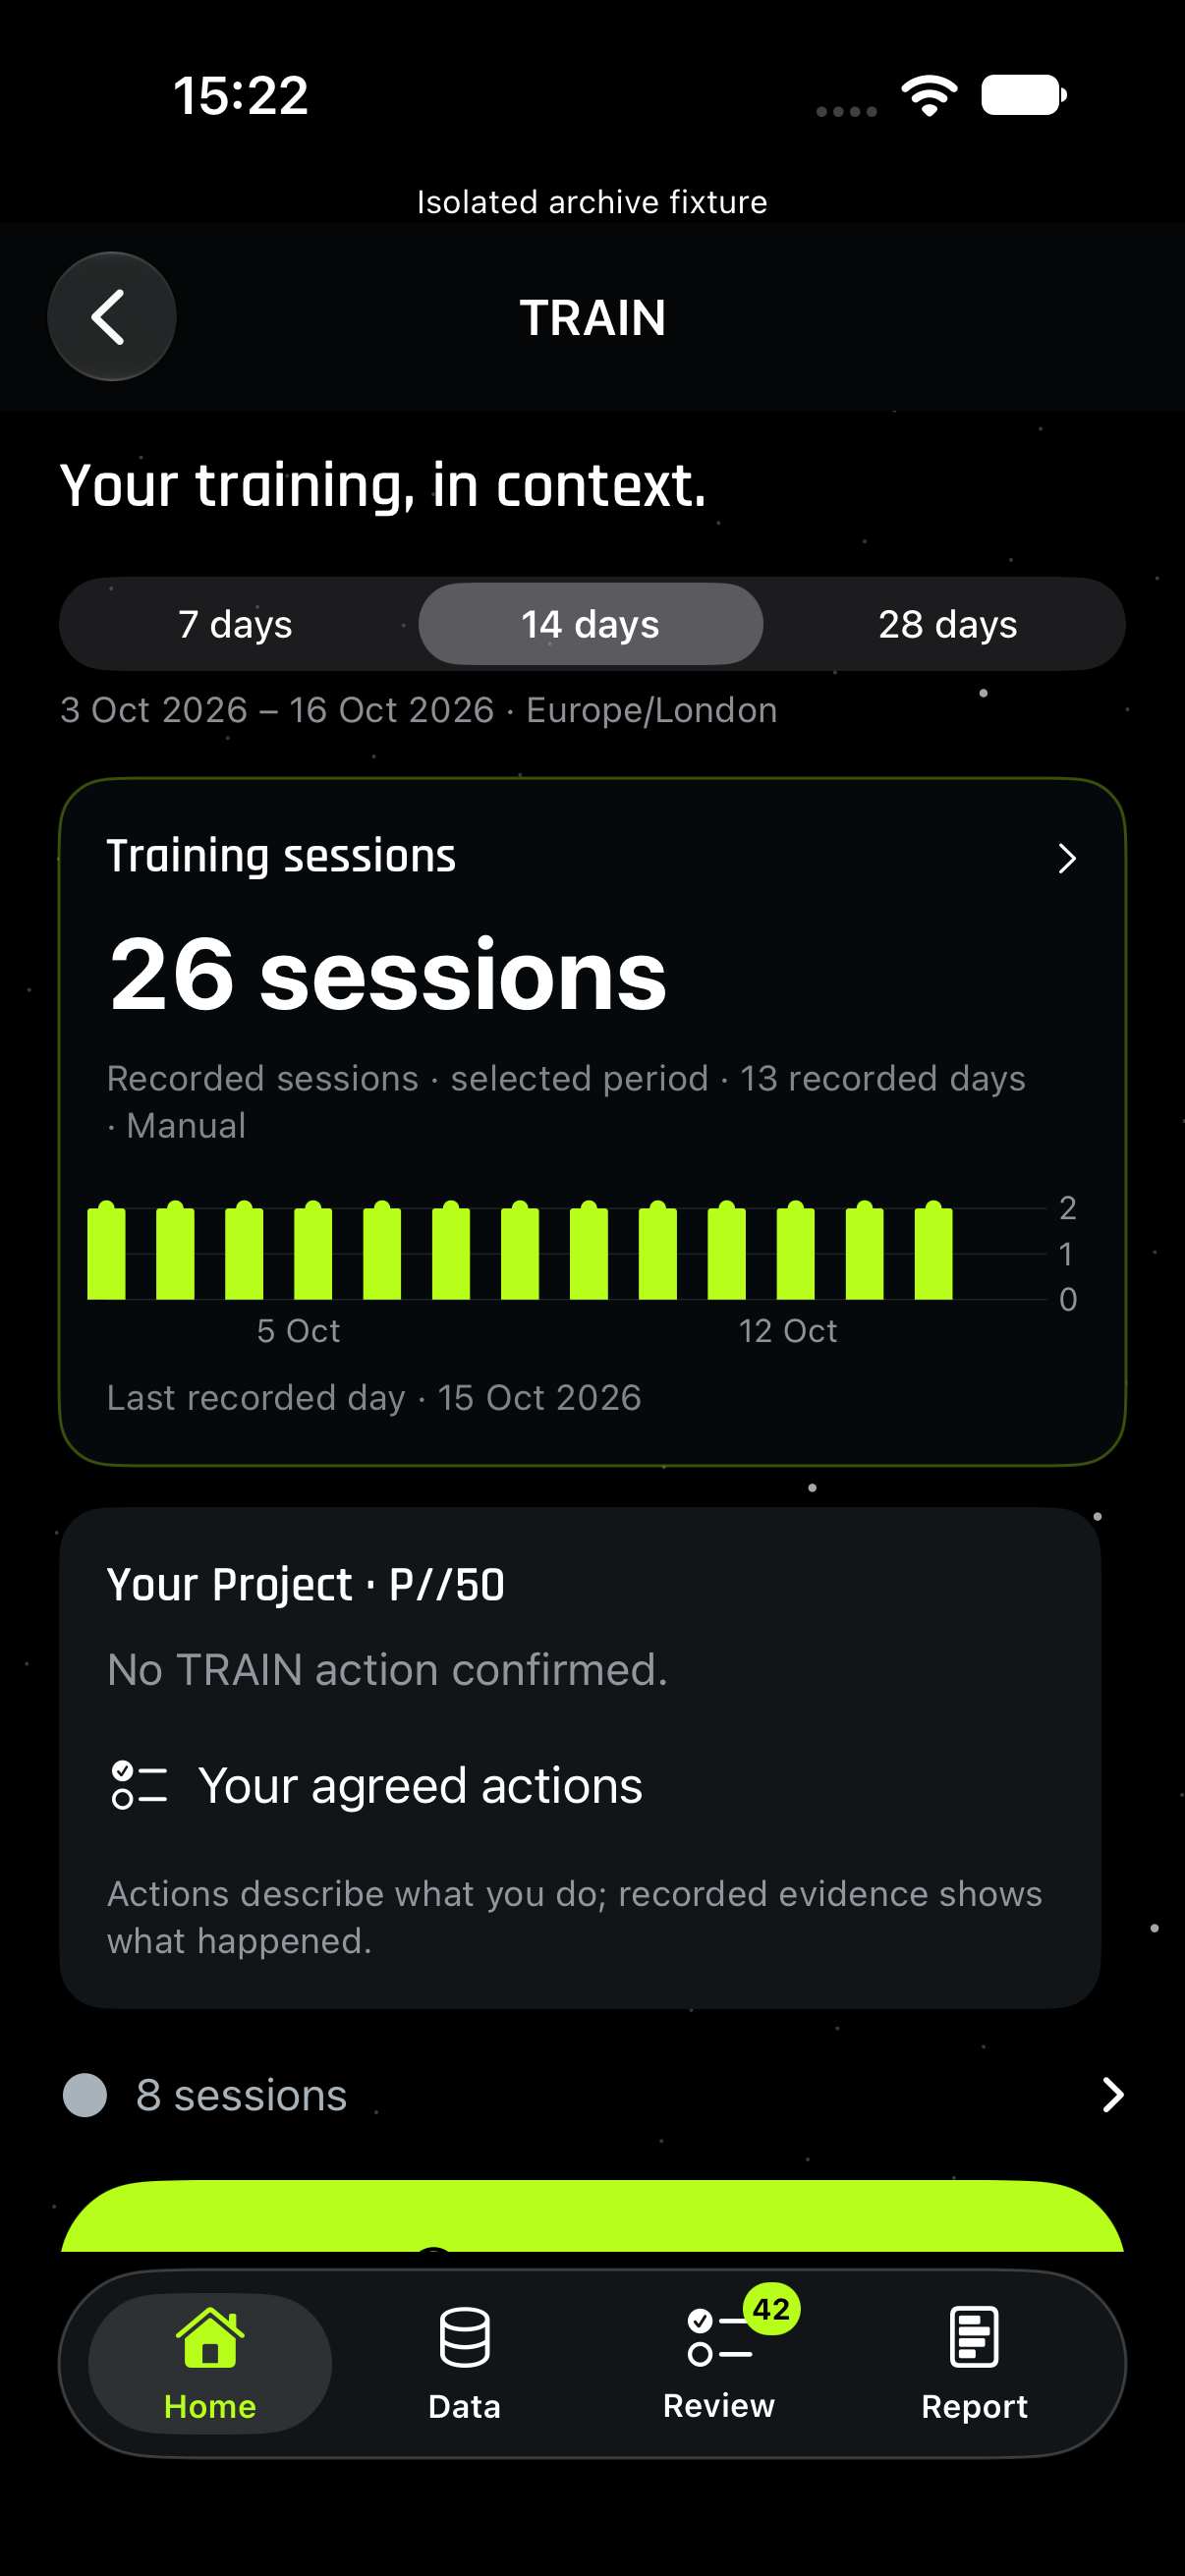
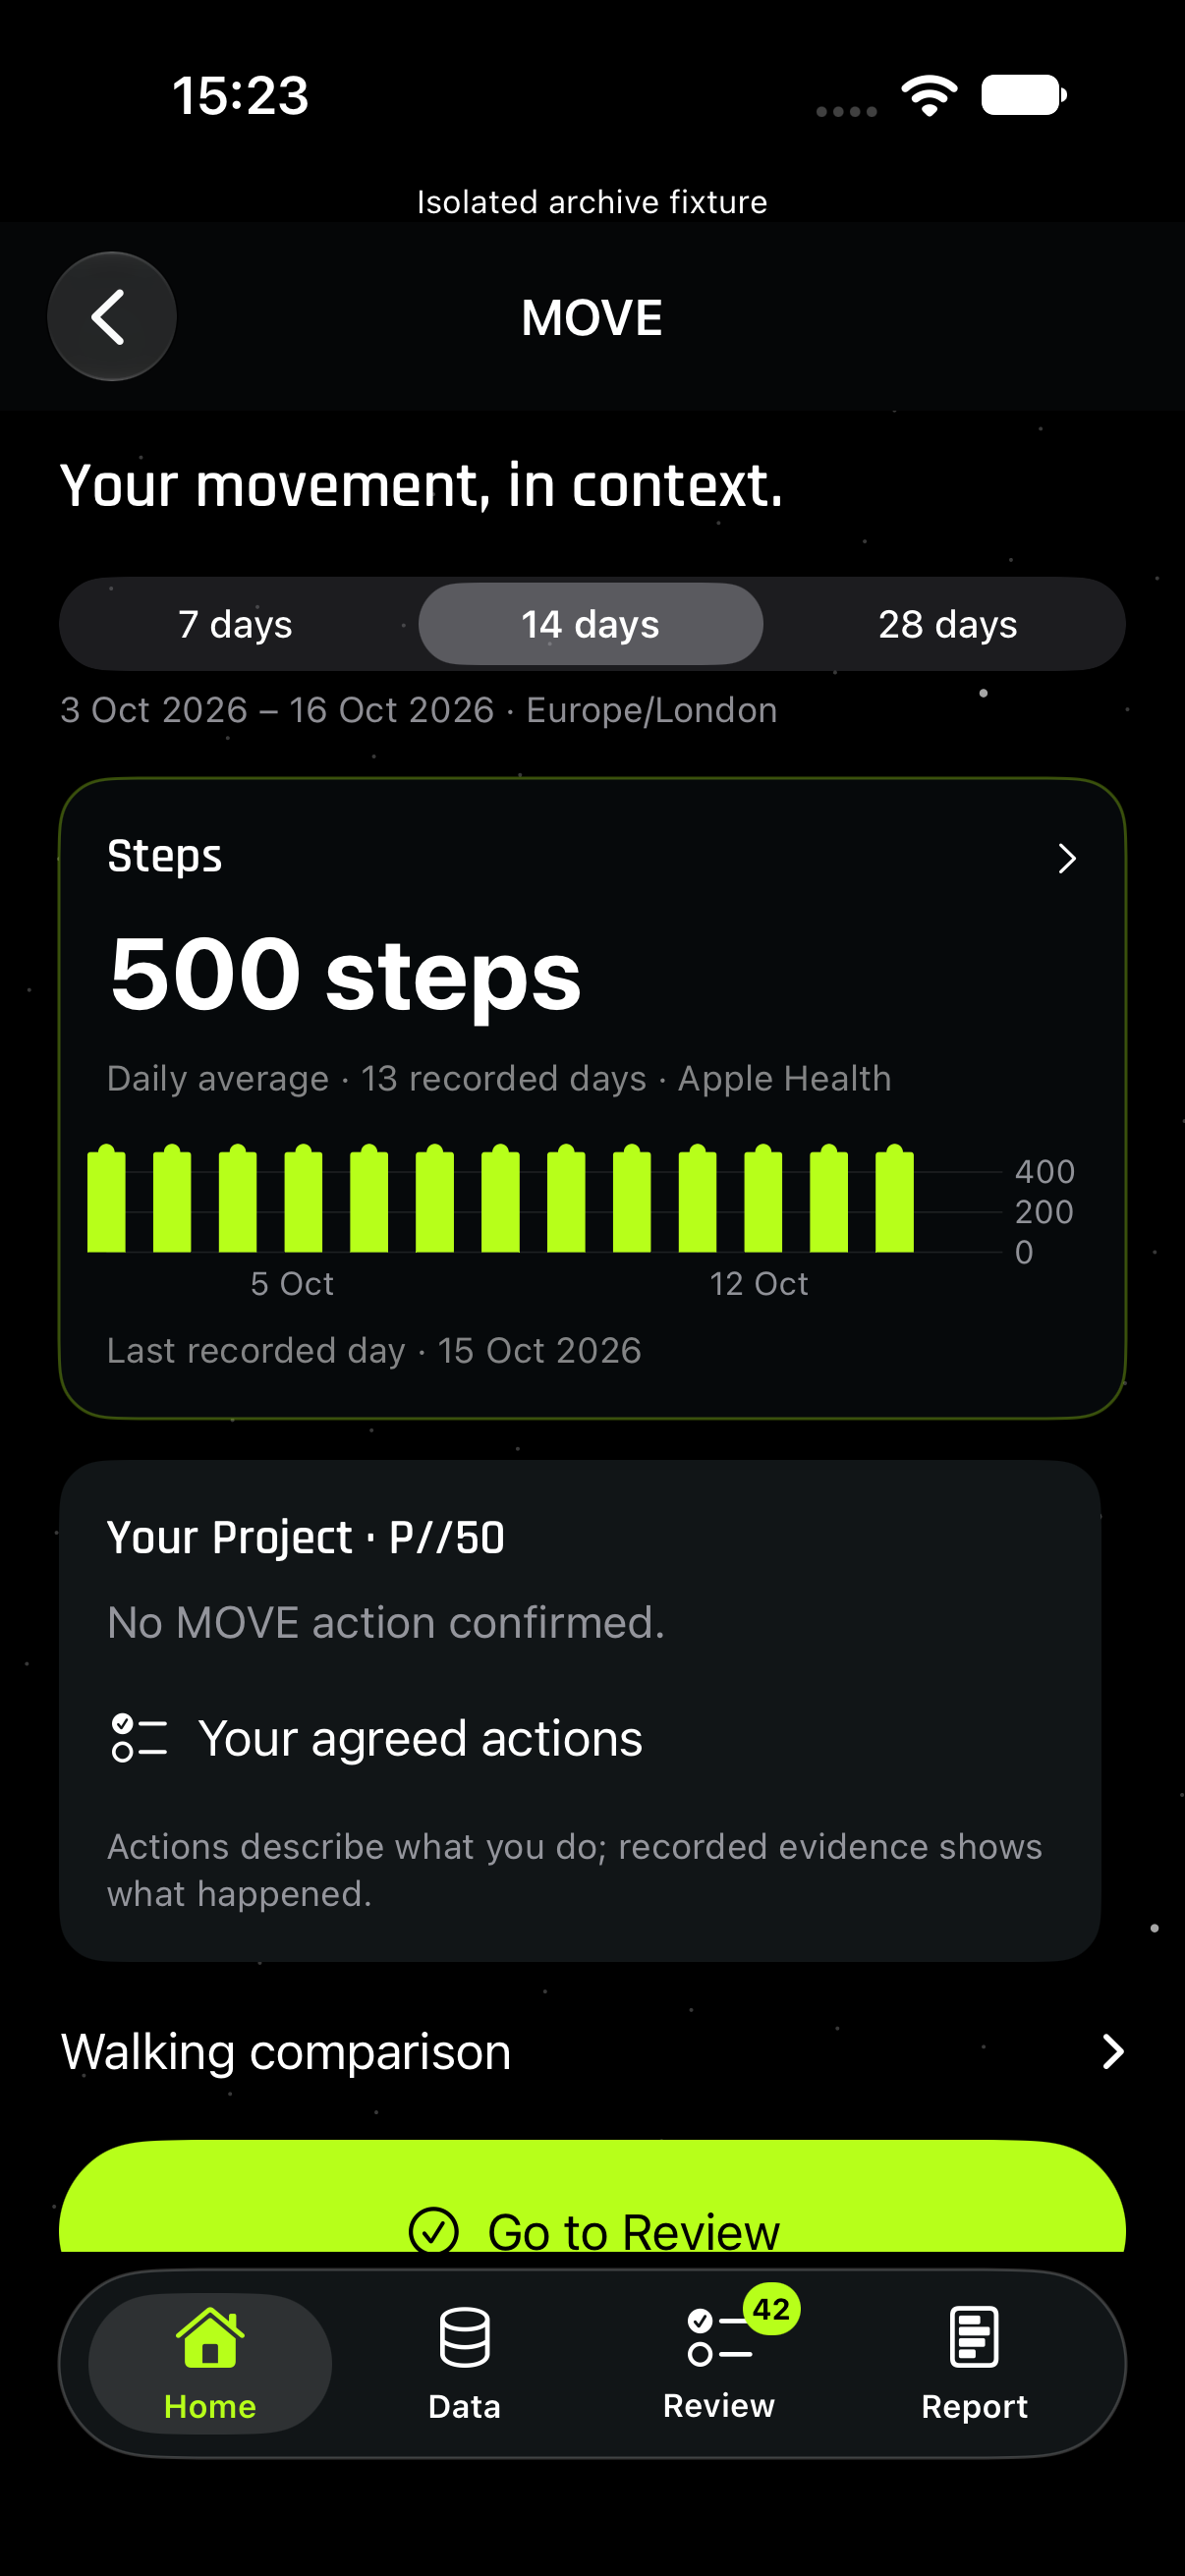
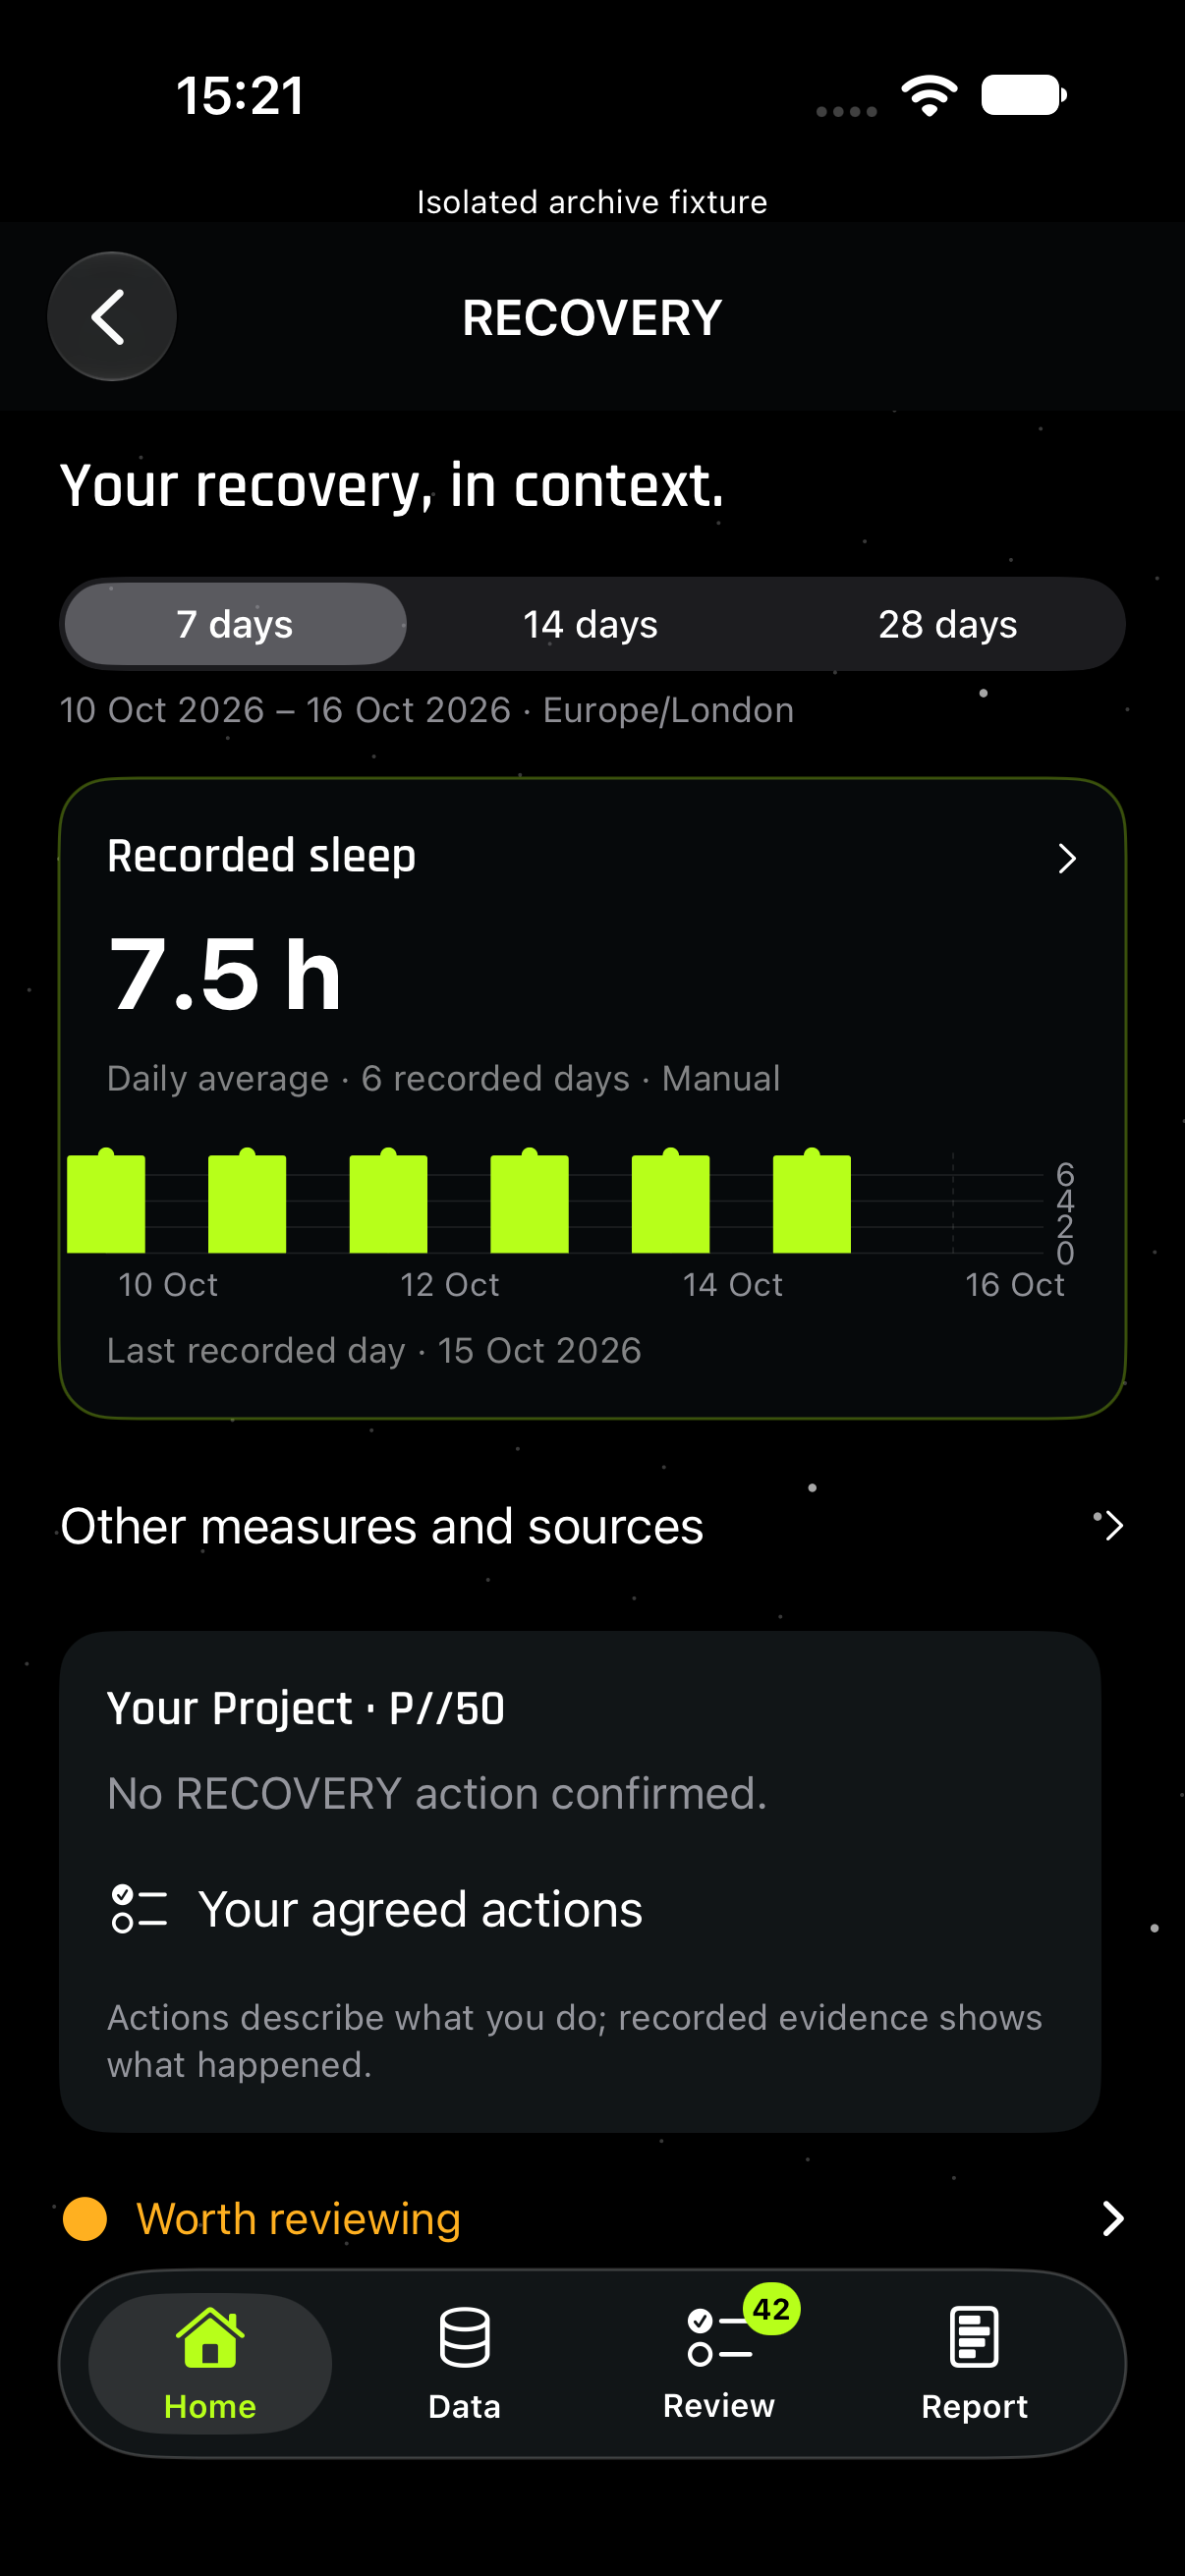
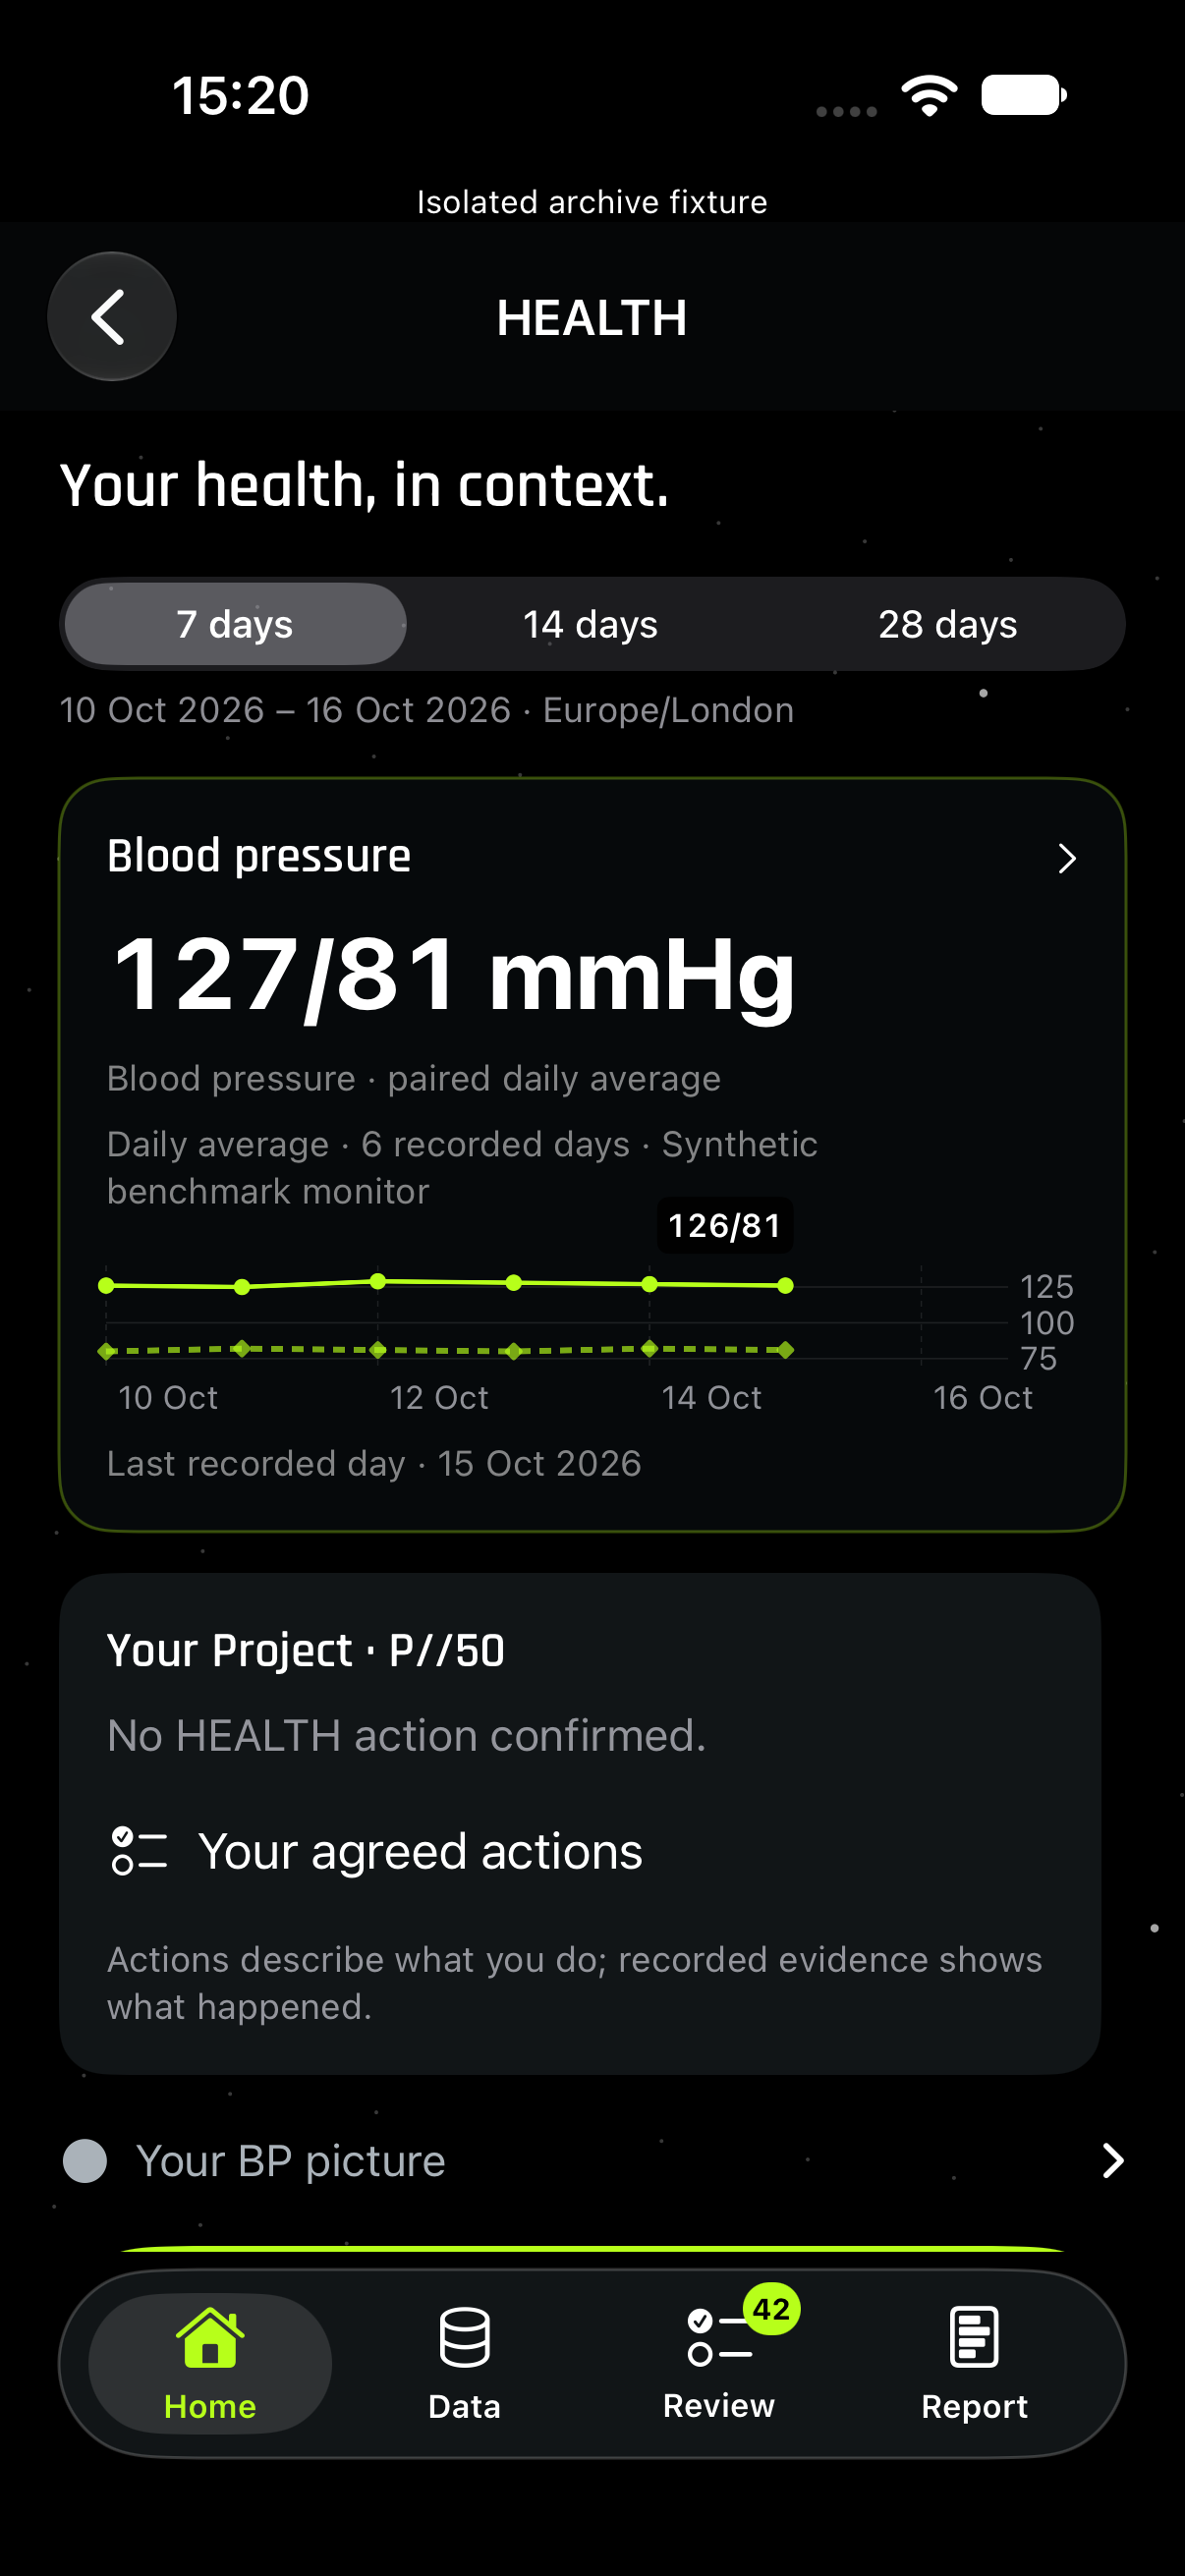




Your health and fitness data belong together. R//V connects your body, nutrition, training, movement, recovery and health around the goals that matter to you.
Weekly averages; TRAIN shows weekly totals. Each lane uses its own scale and units. Shared timing shows co-occurring changes, not cause and effect.
Project progress
BODY GOAL
33%of weight goal
START82.4 kgCURRENT81.6 kgGOAL80.0 kg
0.8 of 2.4 kg reduction achieved. 1.6 kg remains to the demo goal.
Project time elapsed 28 / 56 days
1 Sep–26 Oct · Elapsed time is separate from outcome progress. No completion forecast.
Commitments across the project
WEEKLY VIEW
Fictional commitments and reference alignment
Measure
W1
W2
W3
W4
FUELWithin 5% of allowance
Review
Aligned
Aligned
Aligned
TRAIN3 sessions / week
2 of 3
3 of 3
3 of 3
3 of 3
MOVE9,000 steps / day
Building
Building
Building
Building
RECOVERY7.5 hours / night
Below goal
Below goal
Below goal
Below goal
FUEL uses an illustrative ±5% allowance band. MOVE and RECOVERY compare weekly means with their demo goals. These are example rules, not app scoring.
The connected picture
RESULTANT
01Consistency supports the project.Training meets its plan for three weeks; fuelling moves closer to its allowance.
02Outcome evidence is moving.Average weight is down 0.8 kg while daily movement increases by 2,500 steps.
03Recovery is the gap to review.Sleep falls 0.8 hours/night alongside lower HRV and higher resting heart rate.
HEALTH readings remain broadly steady. This synthesis keeps action commitments, measured outcomes and recovery signals distinct.
DEMO DATA · All values, goals, dates and commitments are invented. The progress ring represents one weight goal; it is not an overall health score. Explore the evidence by vector
Steps in one place. Nutrition in another. Training and sleep in separate views. It can be difficult to see what those records mean for the goal you are working towards.
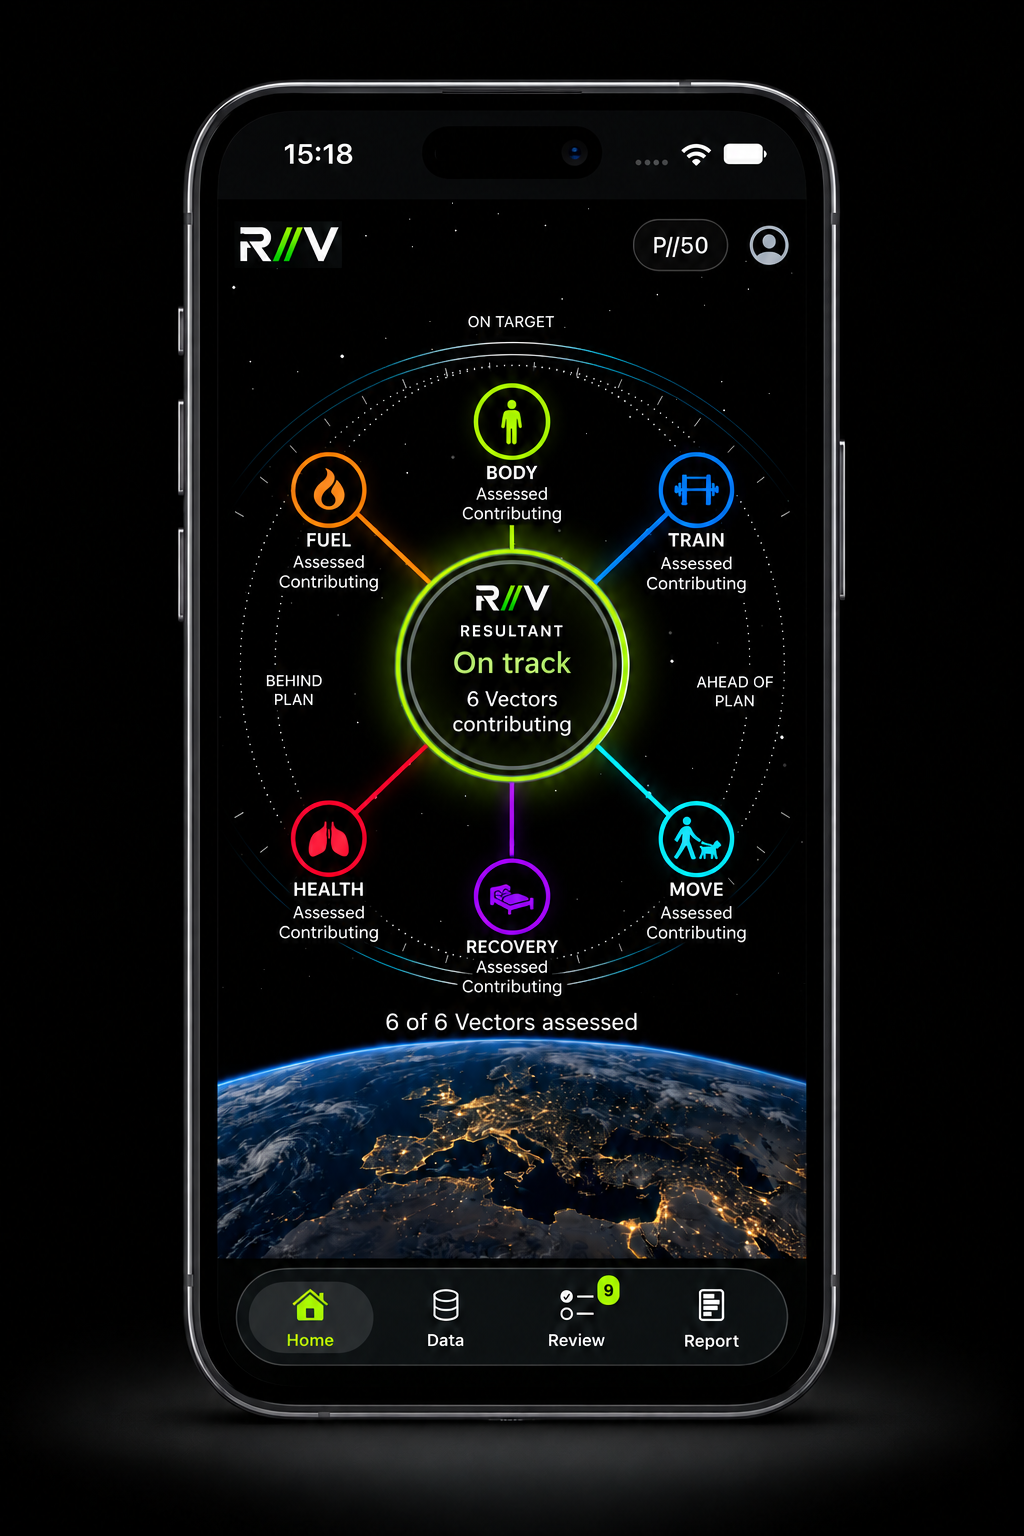
R//V brings six vectors around one personal project, connecting the actions you take with the measurements that show how things are changing.
Your goal sets the direction. Your evidence shows the trend.
HOW R//V WORKS
One project. A connected view.
01
Set your project
Start with what you want to work towards. Confirm your goals, timeframe and the commitments that support them.
02
Bring your evidence together
View relevant records across BODY, FUEL, TRAIN, MOVE, RECOVERY and HEALTH, with sources and time periods kept visible.
03
Understand your direction
Review what is changing, what supports your intended direction and where the evidence is still missing.
Actions and outcomes stay distinct: completing a commitment shows consistency; suitable measurements show an outcome trend.
THE BODY VECTOR
Your physical foundation.
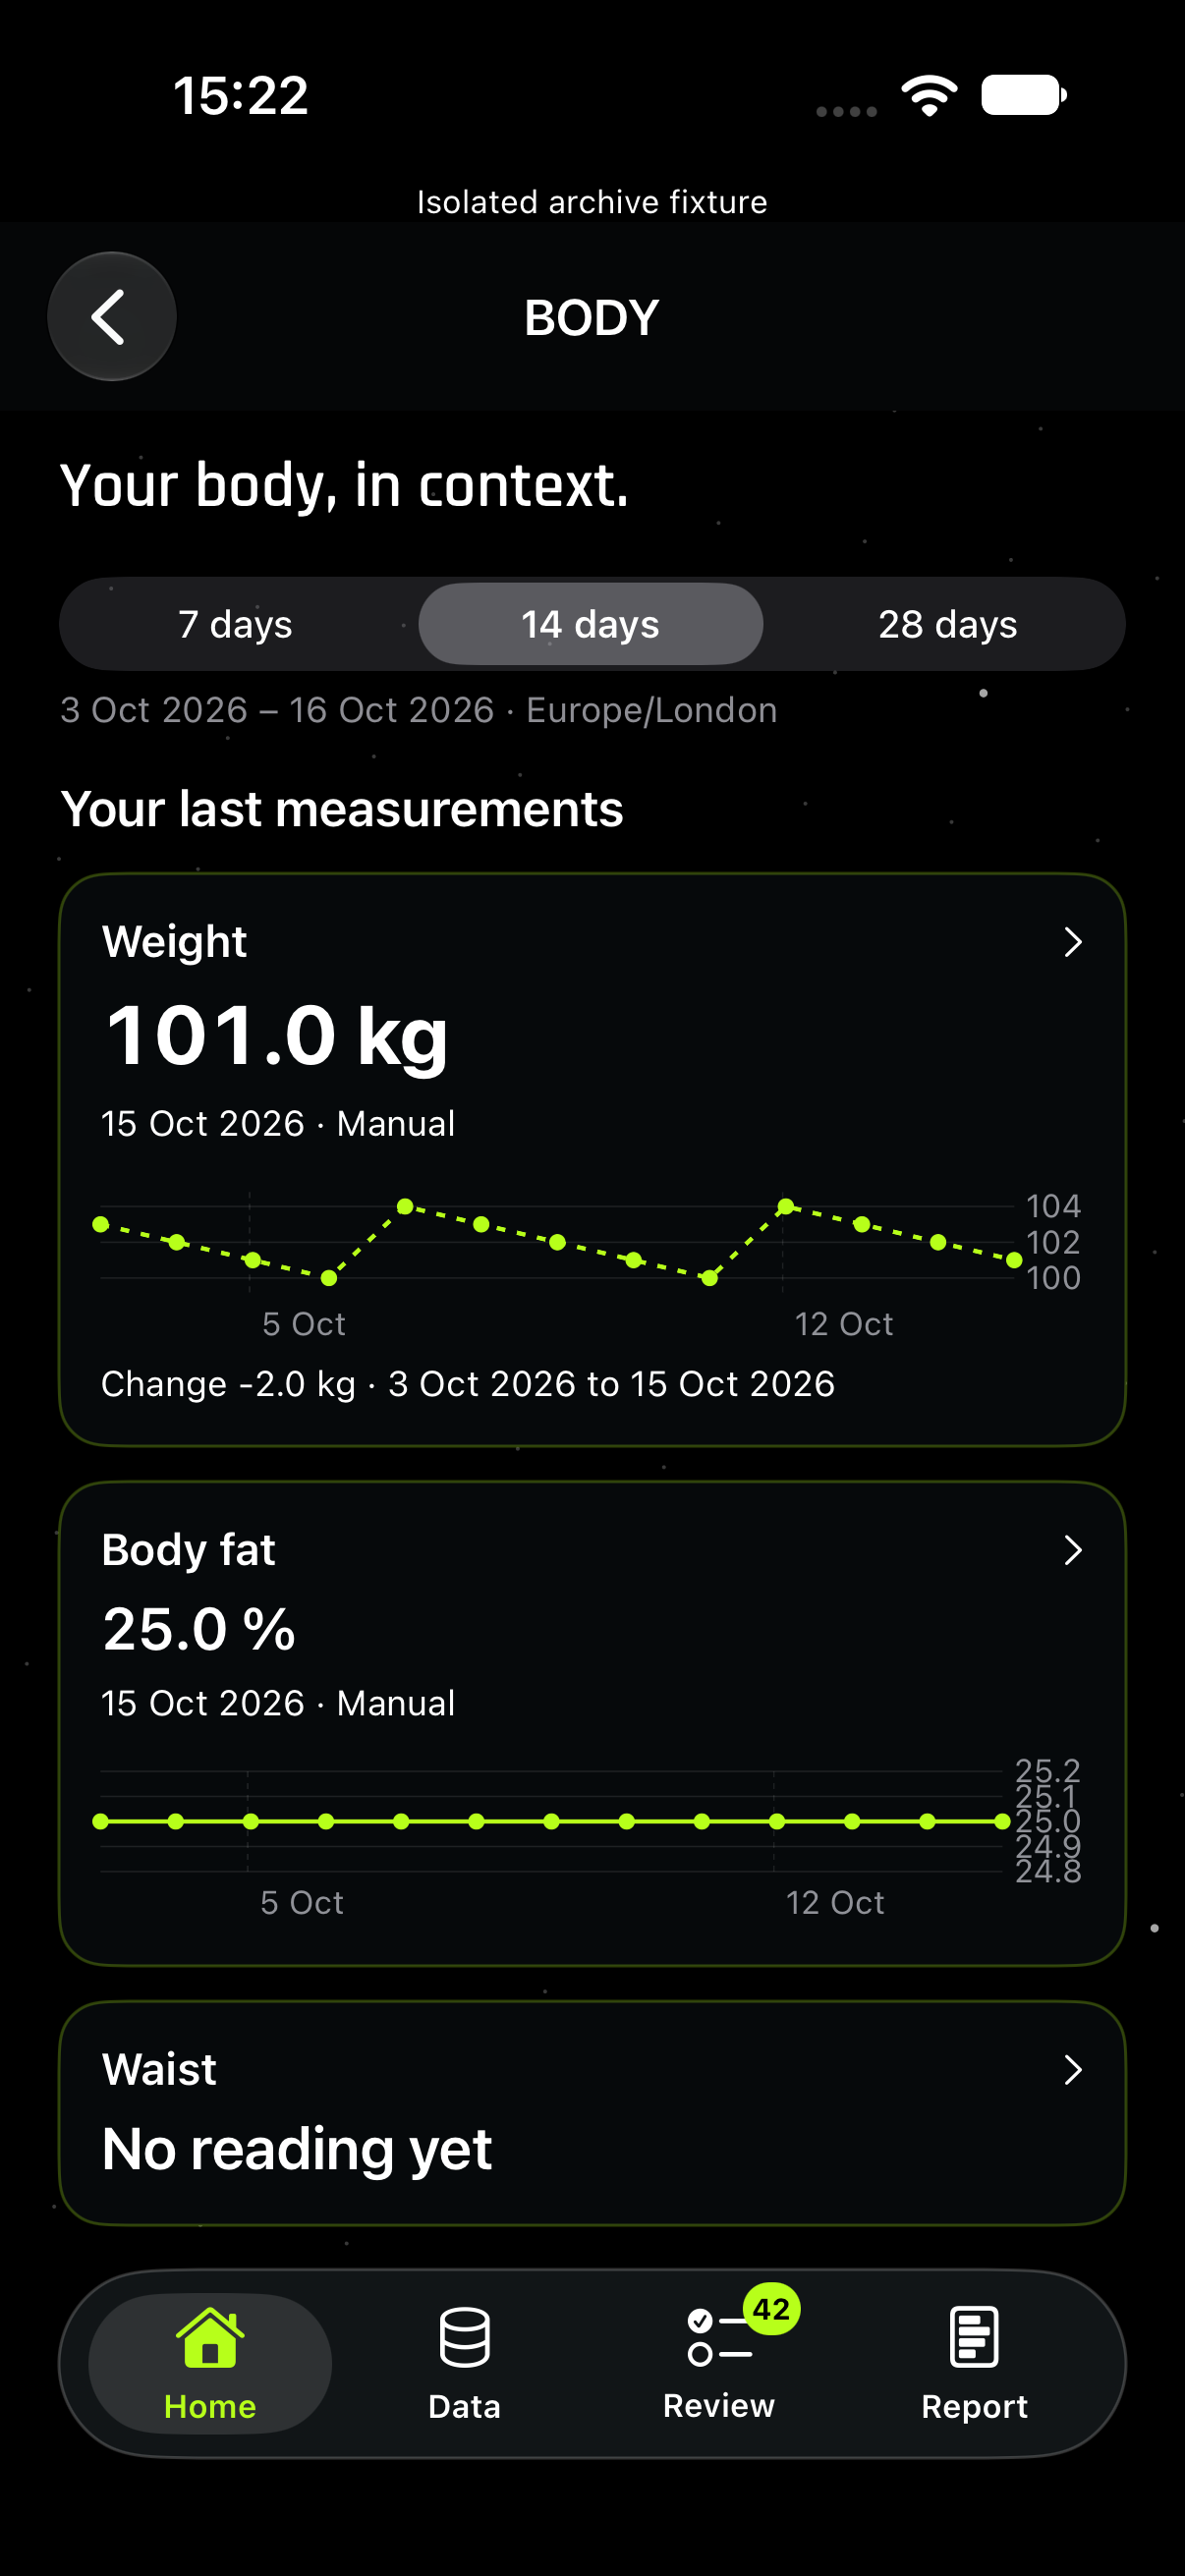
BODY brings weight and body composition together so changes can be understood over time. A single reading is a snapshot; comparable measurements provide the wider picture.
What it brings into view
Weight Recorded body weight and its trend over a chosen period.
Body composition Body-fat measurements where available, with the method and source retained.
Change and coverage How comparable readings have changed, and how much evidence is available.
How it connects
BODY connects physical change with the nutrition, training and movement in your project.
Sources, time periods and coverage belong alongside each measurement. Missing evidence stays unknown.
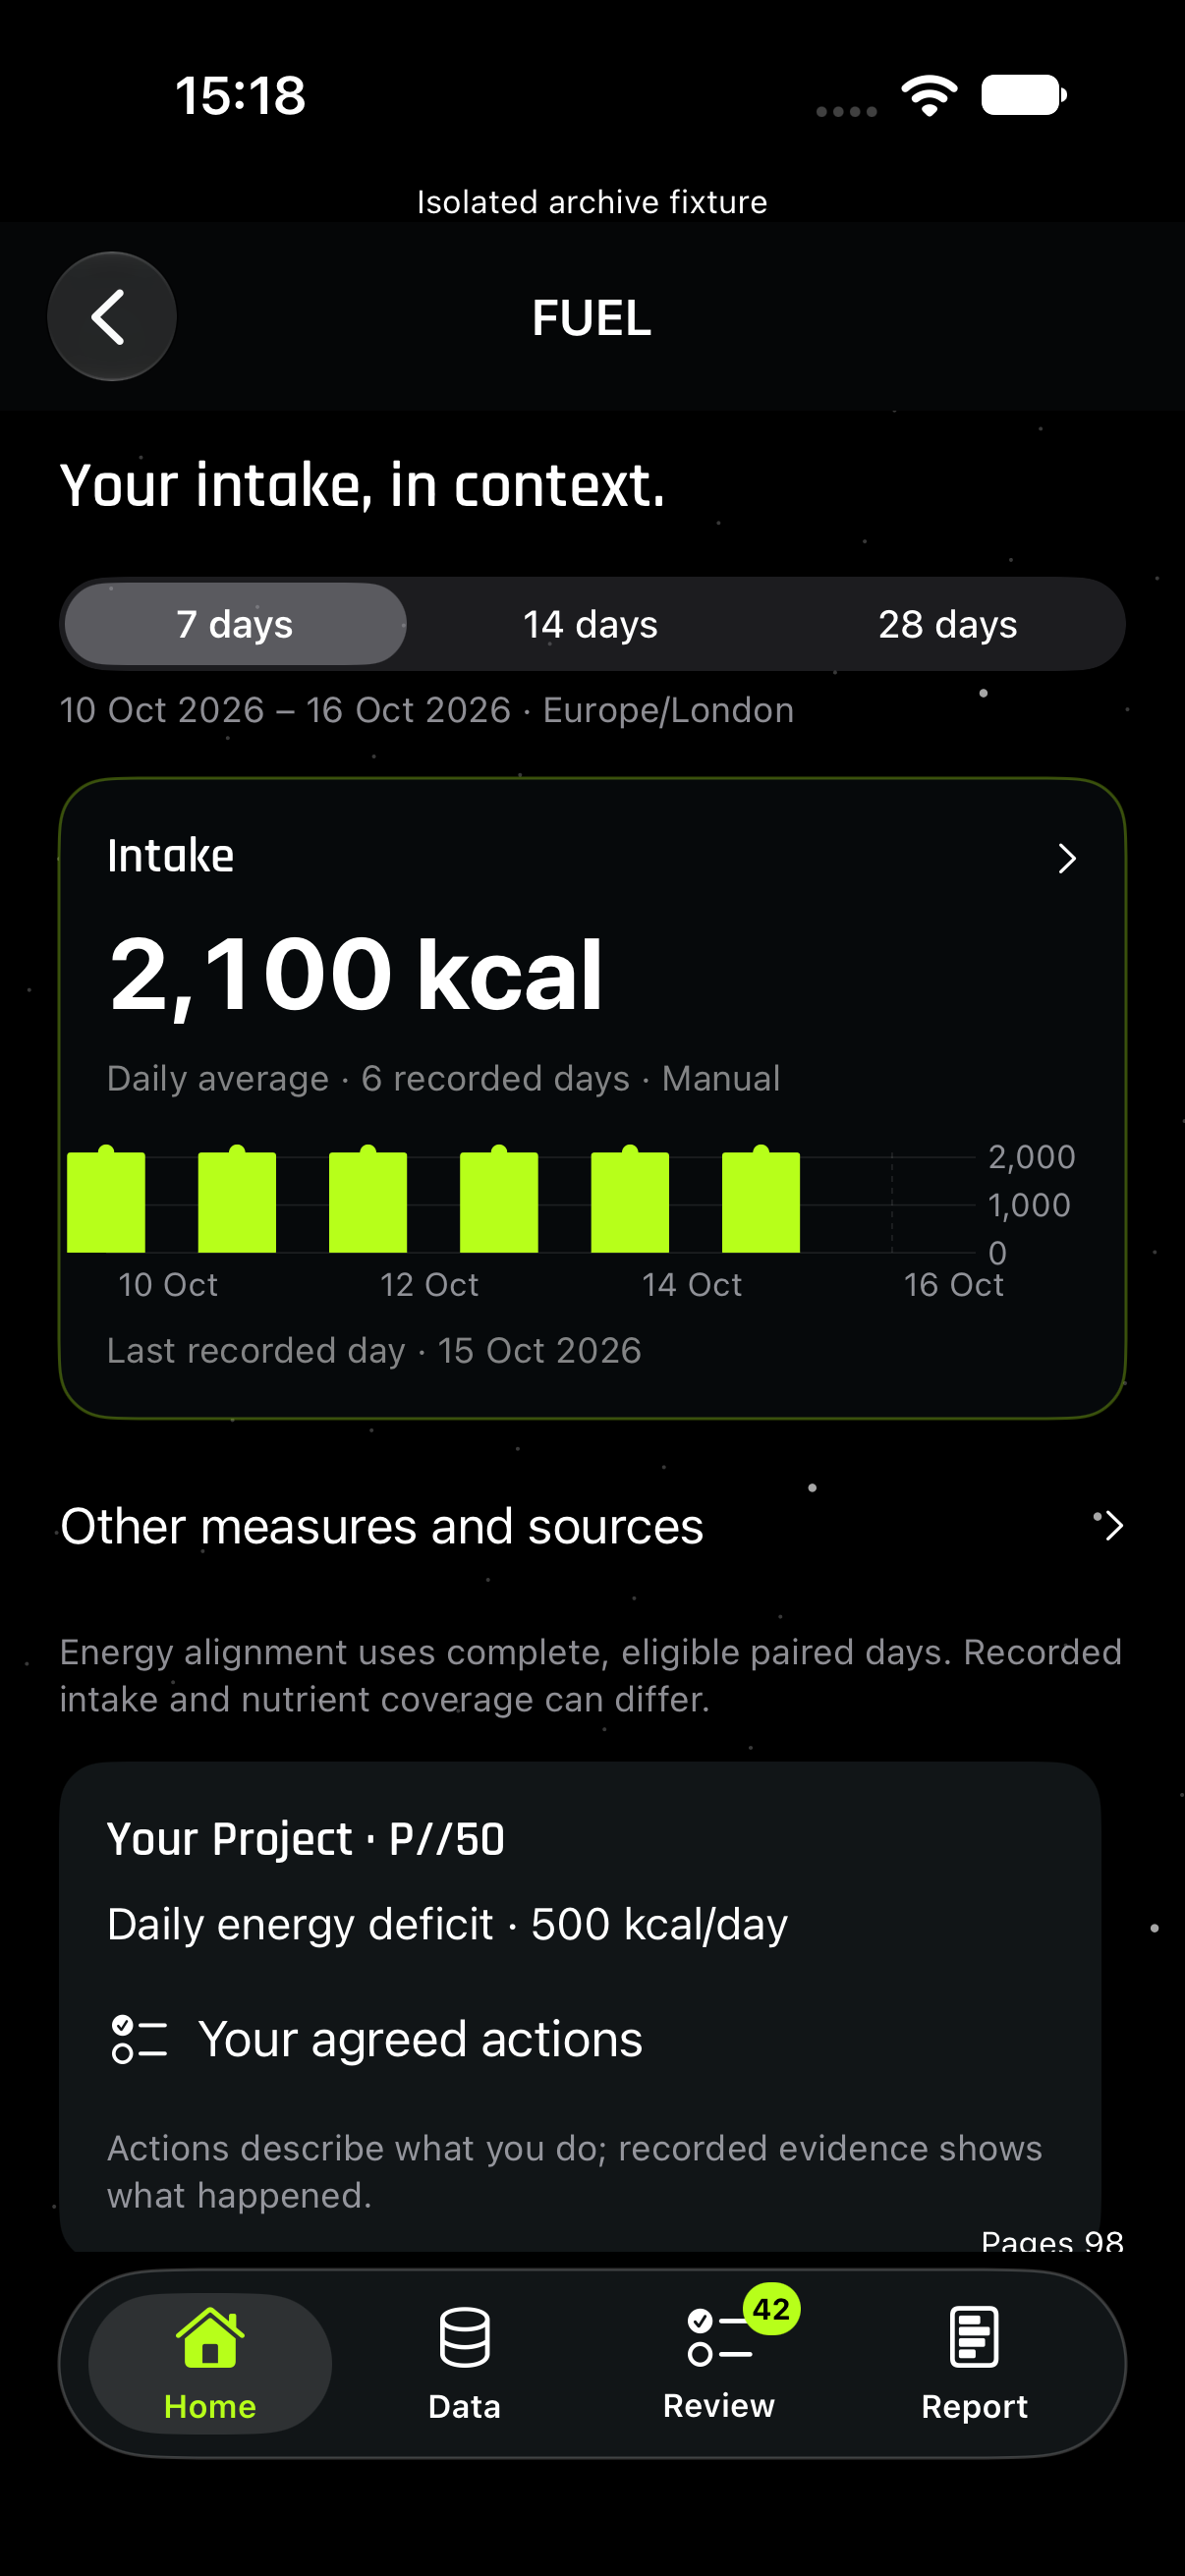
FUEL connects nutrition with your project. It brings energy intake, an allowance and macronutrients into one view so you can understand how your fuelling aligns with your chosen goals.
What it brings into view
Energy alignment Intake shown alongside the allowance used for your project.
Macronutrients Protein, carbohydrate and fat presented with clear amounts and units.
Daily context A view of recorded days, trends and the completeness of your nutrition evidence.
How it connects
FUEL gives BODY and TRAIN context: what you eat sits alongside physical change and training commitments.
Sources, time periods and coverage belong alongside each measurement. Missing evidence stays unknown.
TRAIN covers planned and completed training. Strength and cardio evidence show what you have done, while commitment progress shows how that work compares with your plan.
What it brings into view
Strength Completed strength sessions and relevant session history.
Cardio Recorded cardio sessions or minutes over the selected period.
Consistency Confirmed completion against a training commitment, with gaps kept visible.
How it connects
TRAIN sits alongside FUEL and RECOVERY so work, fuelling and rest can be considered together.
Sources, time periods and coverage belong alongside each measurement. Missing evidence stays unknown.
MOVE covers the activity around your structured training. It brings steps, everyday activity and mobility evidence into view, showing how movement is distributed across your days.
What it brings into view
Steps Recorded step counts and their trend over time.
Activity Everyday activity evidence, kept distinct from structured training.
Mobility and coverage Recorded mobility and the number of days with supporting evidence.
How it connects
MOVE complements TRAIN by showing the movement that happens outside a workout.
Sources, time periods and coverage belong alongside each measurement. Missing evidence stays unknown.
RECOVERY brings sleep, recorded heart-rate signals and subjective reports into view. Each signal keeps its own meaning and source rather than becoming an unexplained combined score.
What it brings into view
Sleep Recorded duration and patterns across the selected period.
Heart-rate signals HRV and resting heart rate where supported, shown separately.
How you feel Subjective recovery reports, visibly distinguished from measured signals.
How it connects
RECOVERY adds context to training and daily activity. A changing signal is something to review alongside its source and wider history.
Sources, time periods and coverage belong alongside each measurement. Missing evidence stays unknown.
HEALTH organises recorded vital signs and their history. Readings remain visible with their units, source and time period so you can see the evidence in context.
What it brings into view
Blood pressure Paired readings with systolic and diastolic values kept separate.
Oxygen and respiration Recorded oxygen saturation and respiration values where available.
Trends and coverage The readings behind each trend and the days they cover.
How it connects
HEALTH contributes recorded facts to the wider picture. The demo direction label describes a fictional trend, not a clinical assessment.
Sources, time periods and coverage belong alongside each measurement. Missing evidence stays unknown.
A fictional four-week project: gradually reduce weight, complete three training sessions a week and increase everyday movement, while keeping recovery in view.
DEMO DATA — Every measurement, goal and record below is invented. No personal records or connected accounts are used. Goals belong only to this fictional example.
Solid line: fictional recorded valuesDashed line: demo goal or allowanceHorizontal axis: September day, or training week
In the fictional project, weight falls 0.8 kg, daily steps rise by 2,500 and intake gets closer to the allowance. Training meets its plan for three consecutive weeks. Sleep moves away from its goal, while paired blood-pressure readings remain broadly steady.
BODY ↘ Towards goalFUEL ↘ Closer alignmentTRAIN → ConsistentMOVE ↗ Towards goalRECOVERY ↘ Goal gapHEALTH → Steady readings
SIGNALS TO REVIEW TOGETHER
Movement rises. Sleep falls.
The example shows sleep decreasing from 7.4 to 6.6 hours/night, HRV from 54 to 44 ms and resting heart rate increasing from 56 to 59 bpm. These are separate signals to review alongside the training and movement history; the example does not infer a cause or a recovery score.
Week 1 = 1–7 September; Week 4 = 22–28 September. Daily metrics are averaged within each week; training shows weekly totals. Arrows describe change, with labels relating it to the fictional project. Chart scales differ by metric; slopes cannot be compared across vectors. HEALTH shows systolic and diastolic separately. There is no combined health score.
CURRENT STAGE
A working prototype. In active development.
iOS · PRE-RELEASE
BUILT TODAY
The core product
A working iOS prototype with project setup, six vector views, evidence review and reporting. The website demonstrates the approach using fictional data.
IN PROGRESS
Refinement and verification
Interface consistency, accessibility, navigation reliability and the presentation of recorded sensor data are being refined and tested.
NEXT MILESTONE
Prepare for wider testing
Complete device acceptance and release preparation before wider distribution. The app is not yet publicly released.